
Infographics

Infographics

Alaska Air Group Sustainability Report 2012
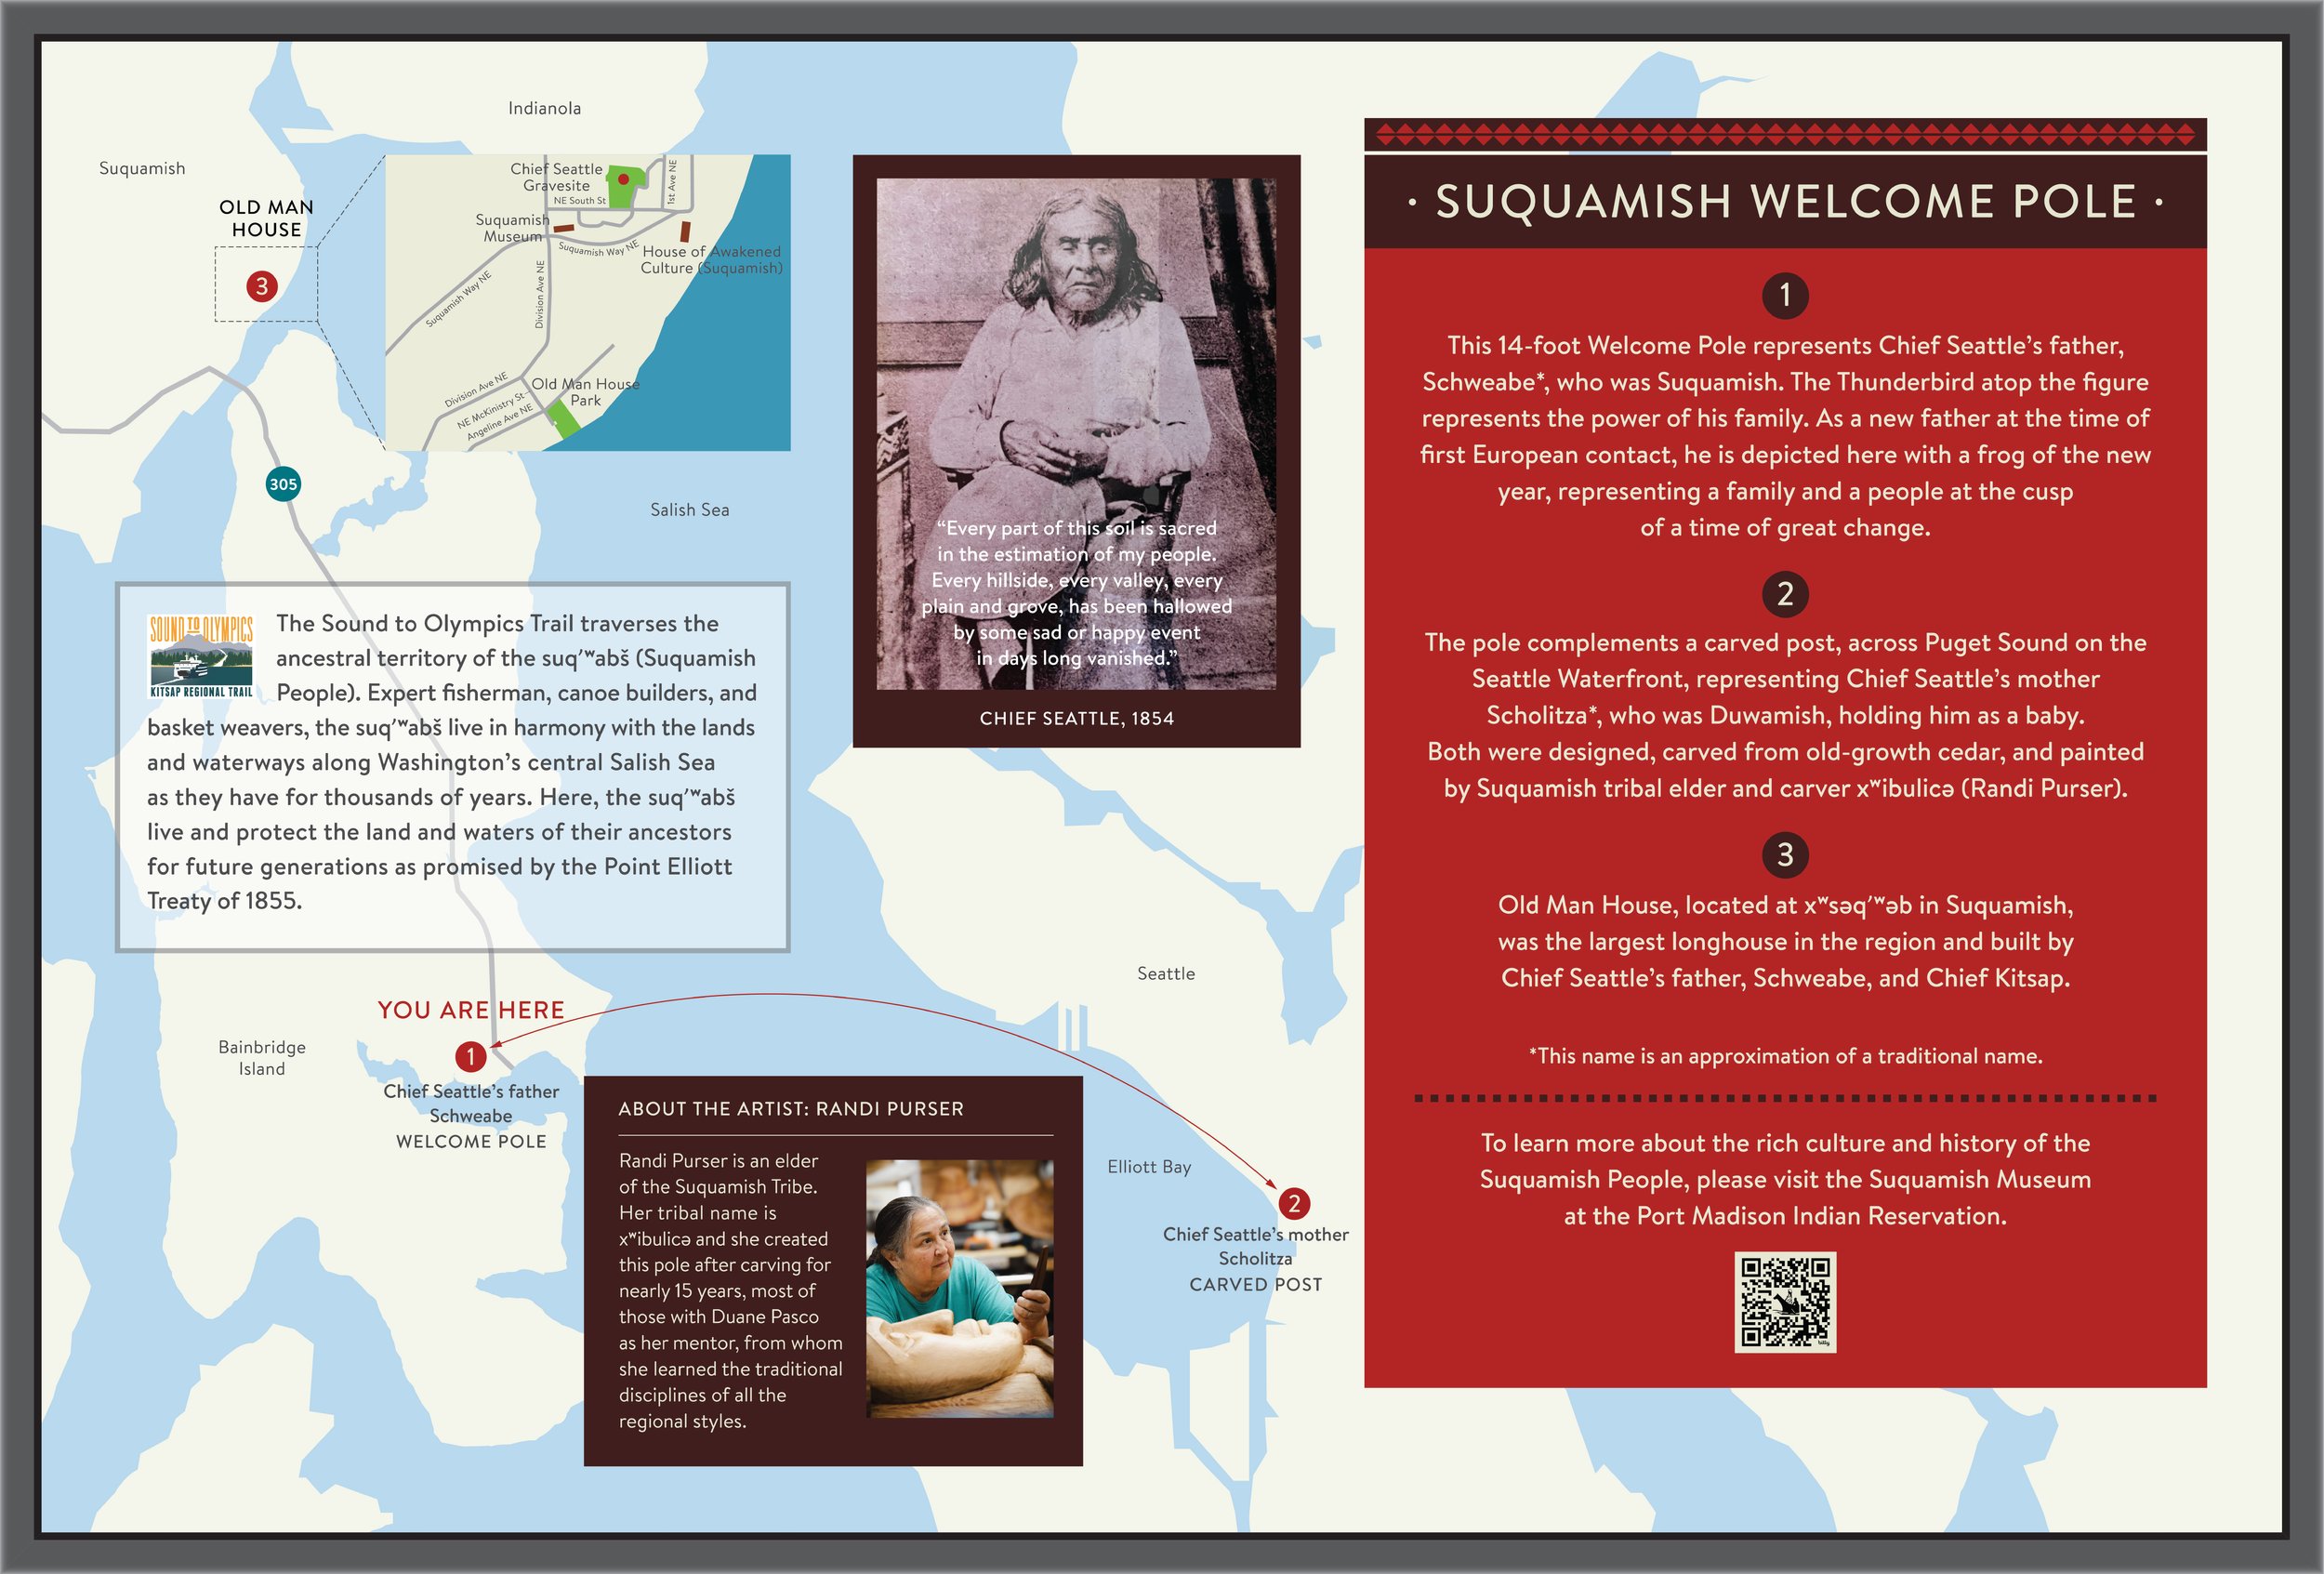
Interpretive sign for the Suquamish Tribe’s “Welcome Pole“ on Bainbridge Island, Washington, that represents Chief Seattle’s father, Schweabe, who was Suquamish.

Icon set for TechnoServe to represent the key industry sectors that are the focus of their nonprofit development work. Agency: Kite
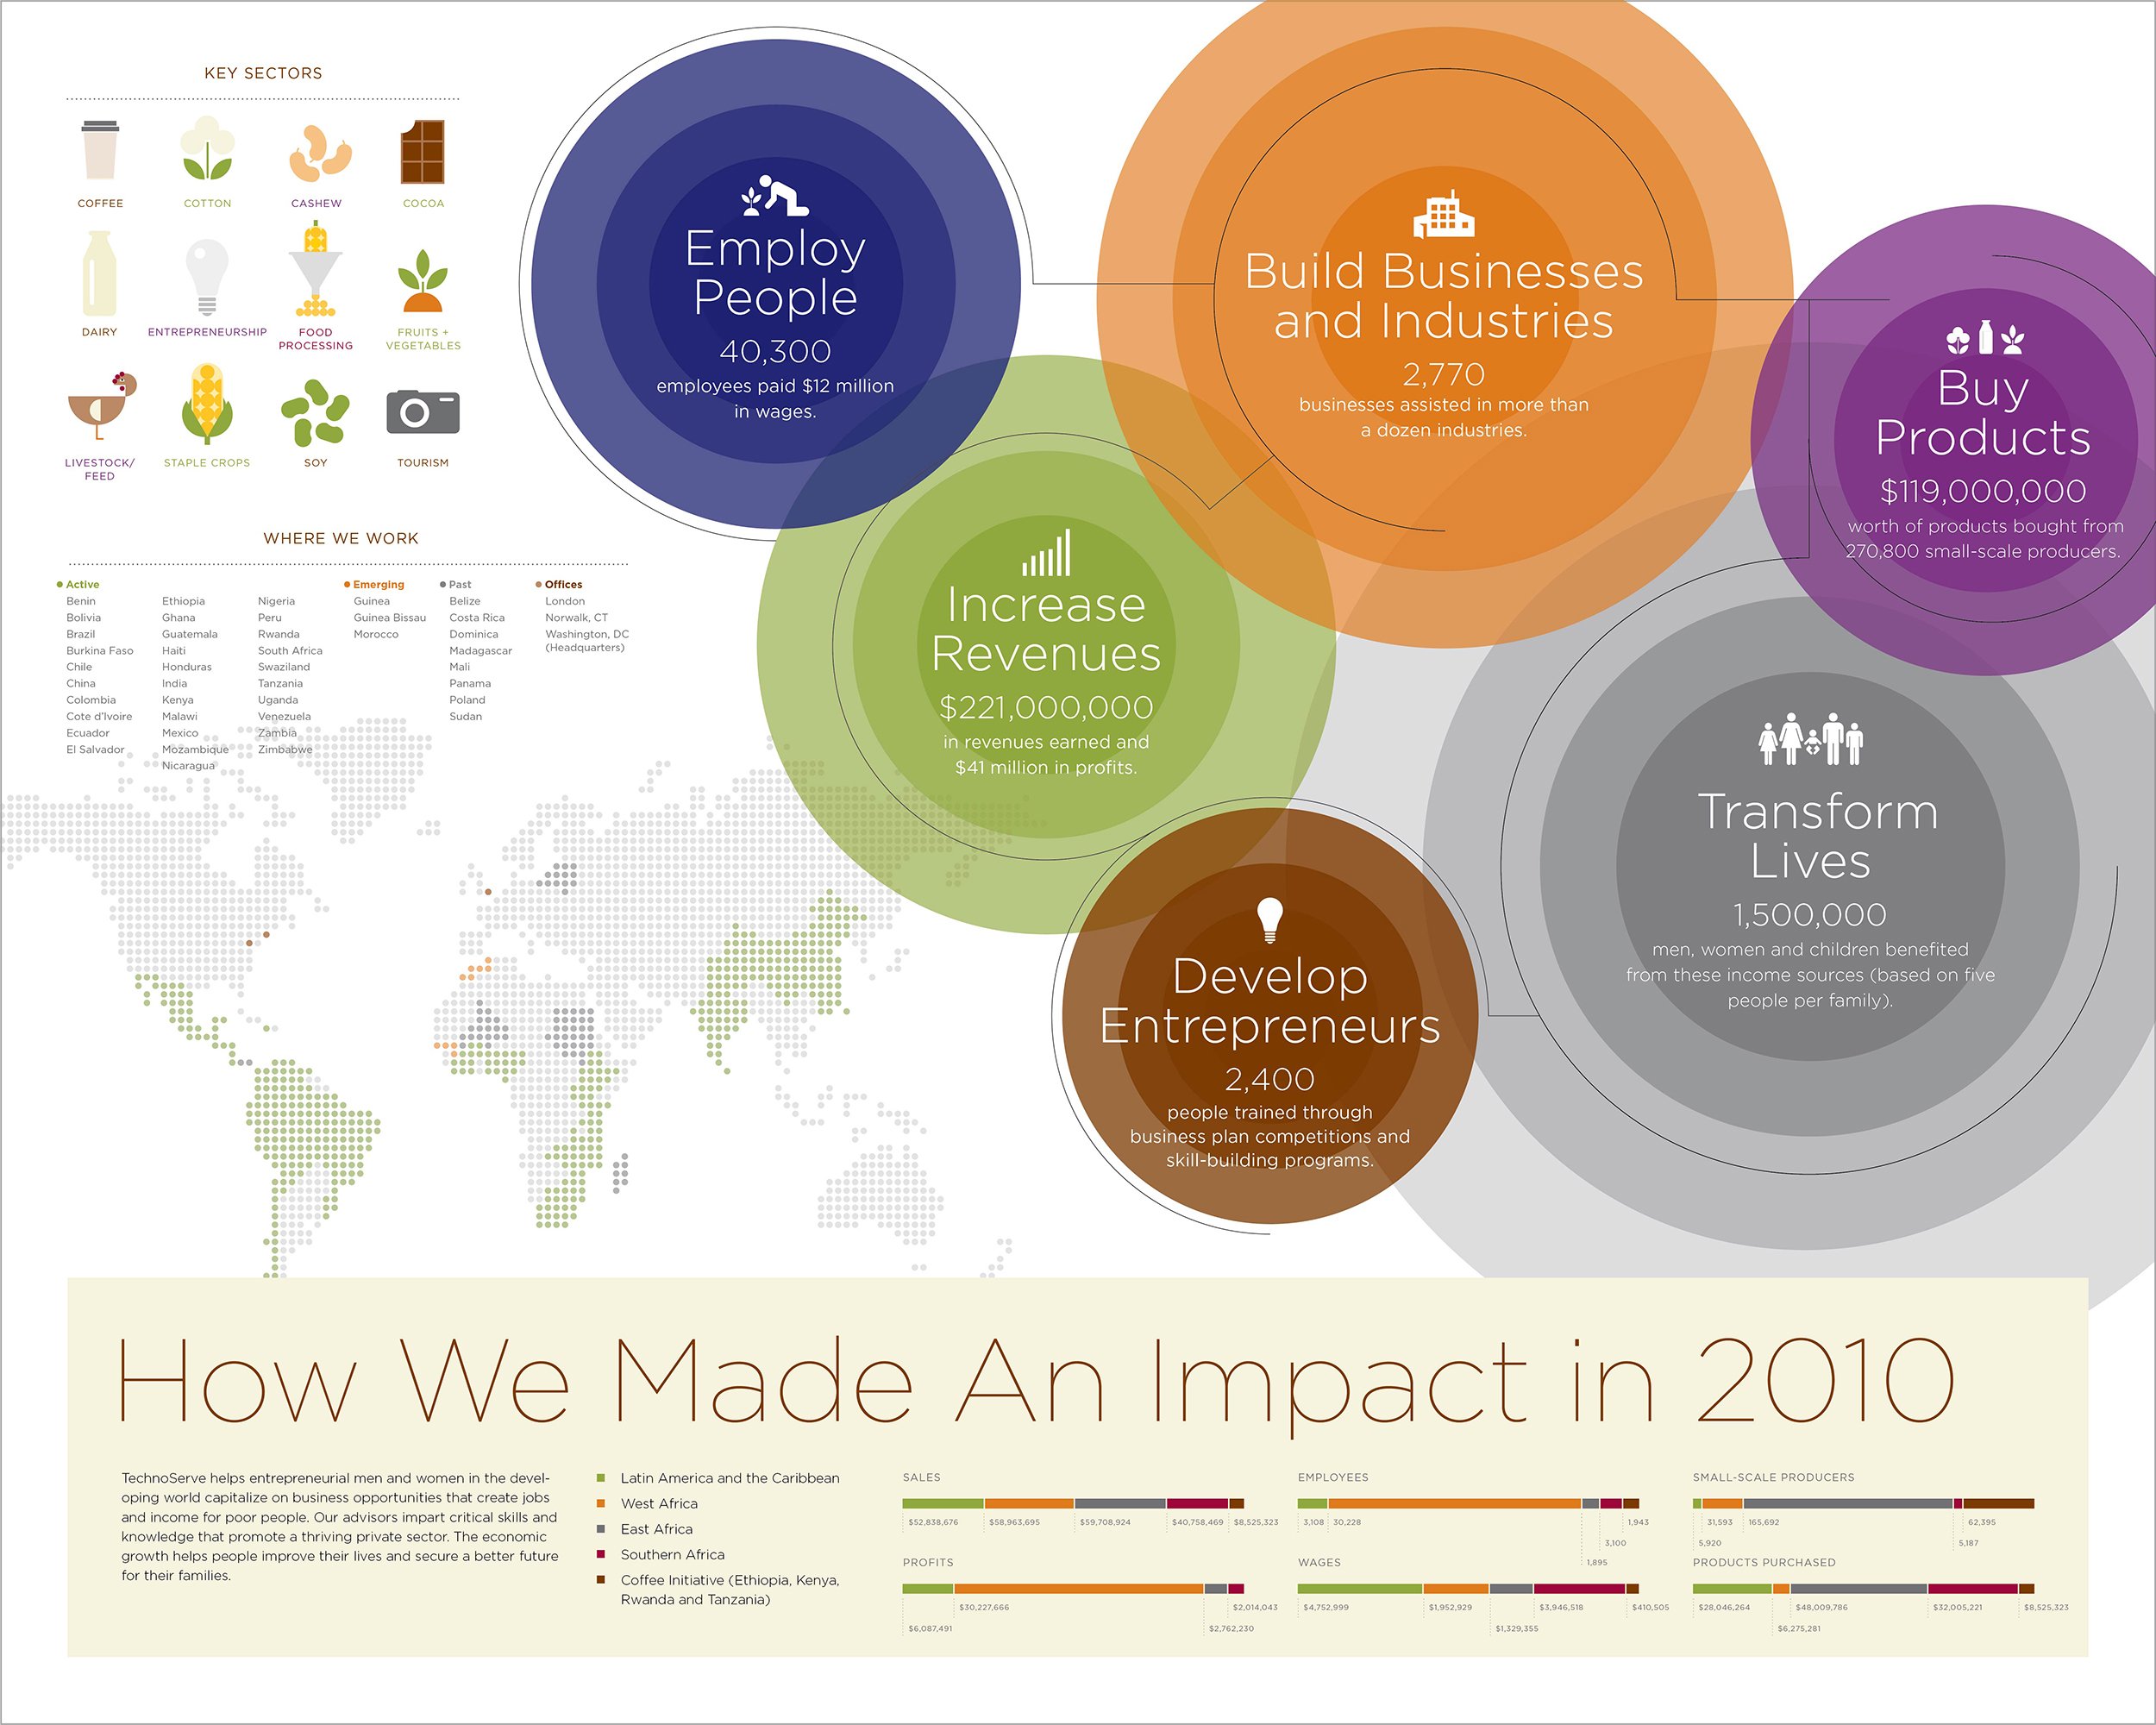
TechnoServe Annual Report 2010. Agency: Kite

Infographic created as part of a pitch deck for the Walla Walla Foundry in Walla Walla, Washington, to demonstrate the foundry’s broad technical capabilities.
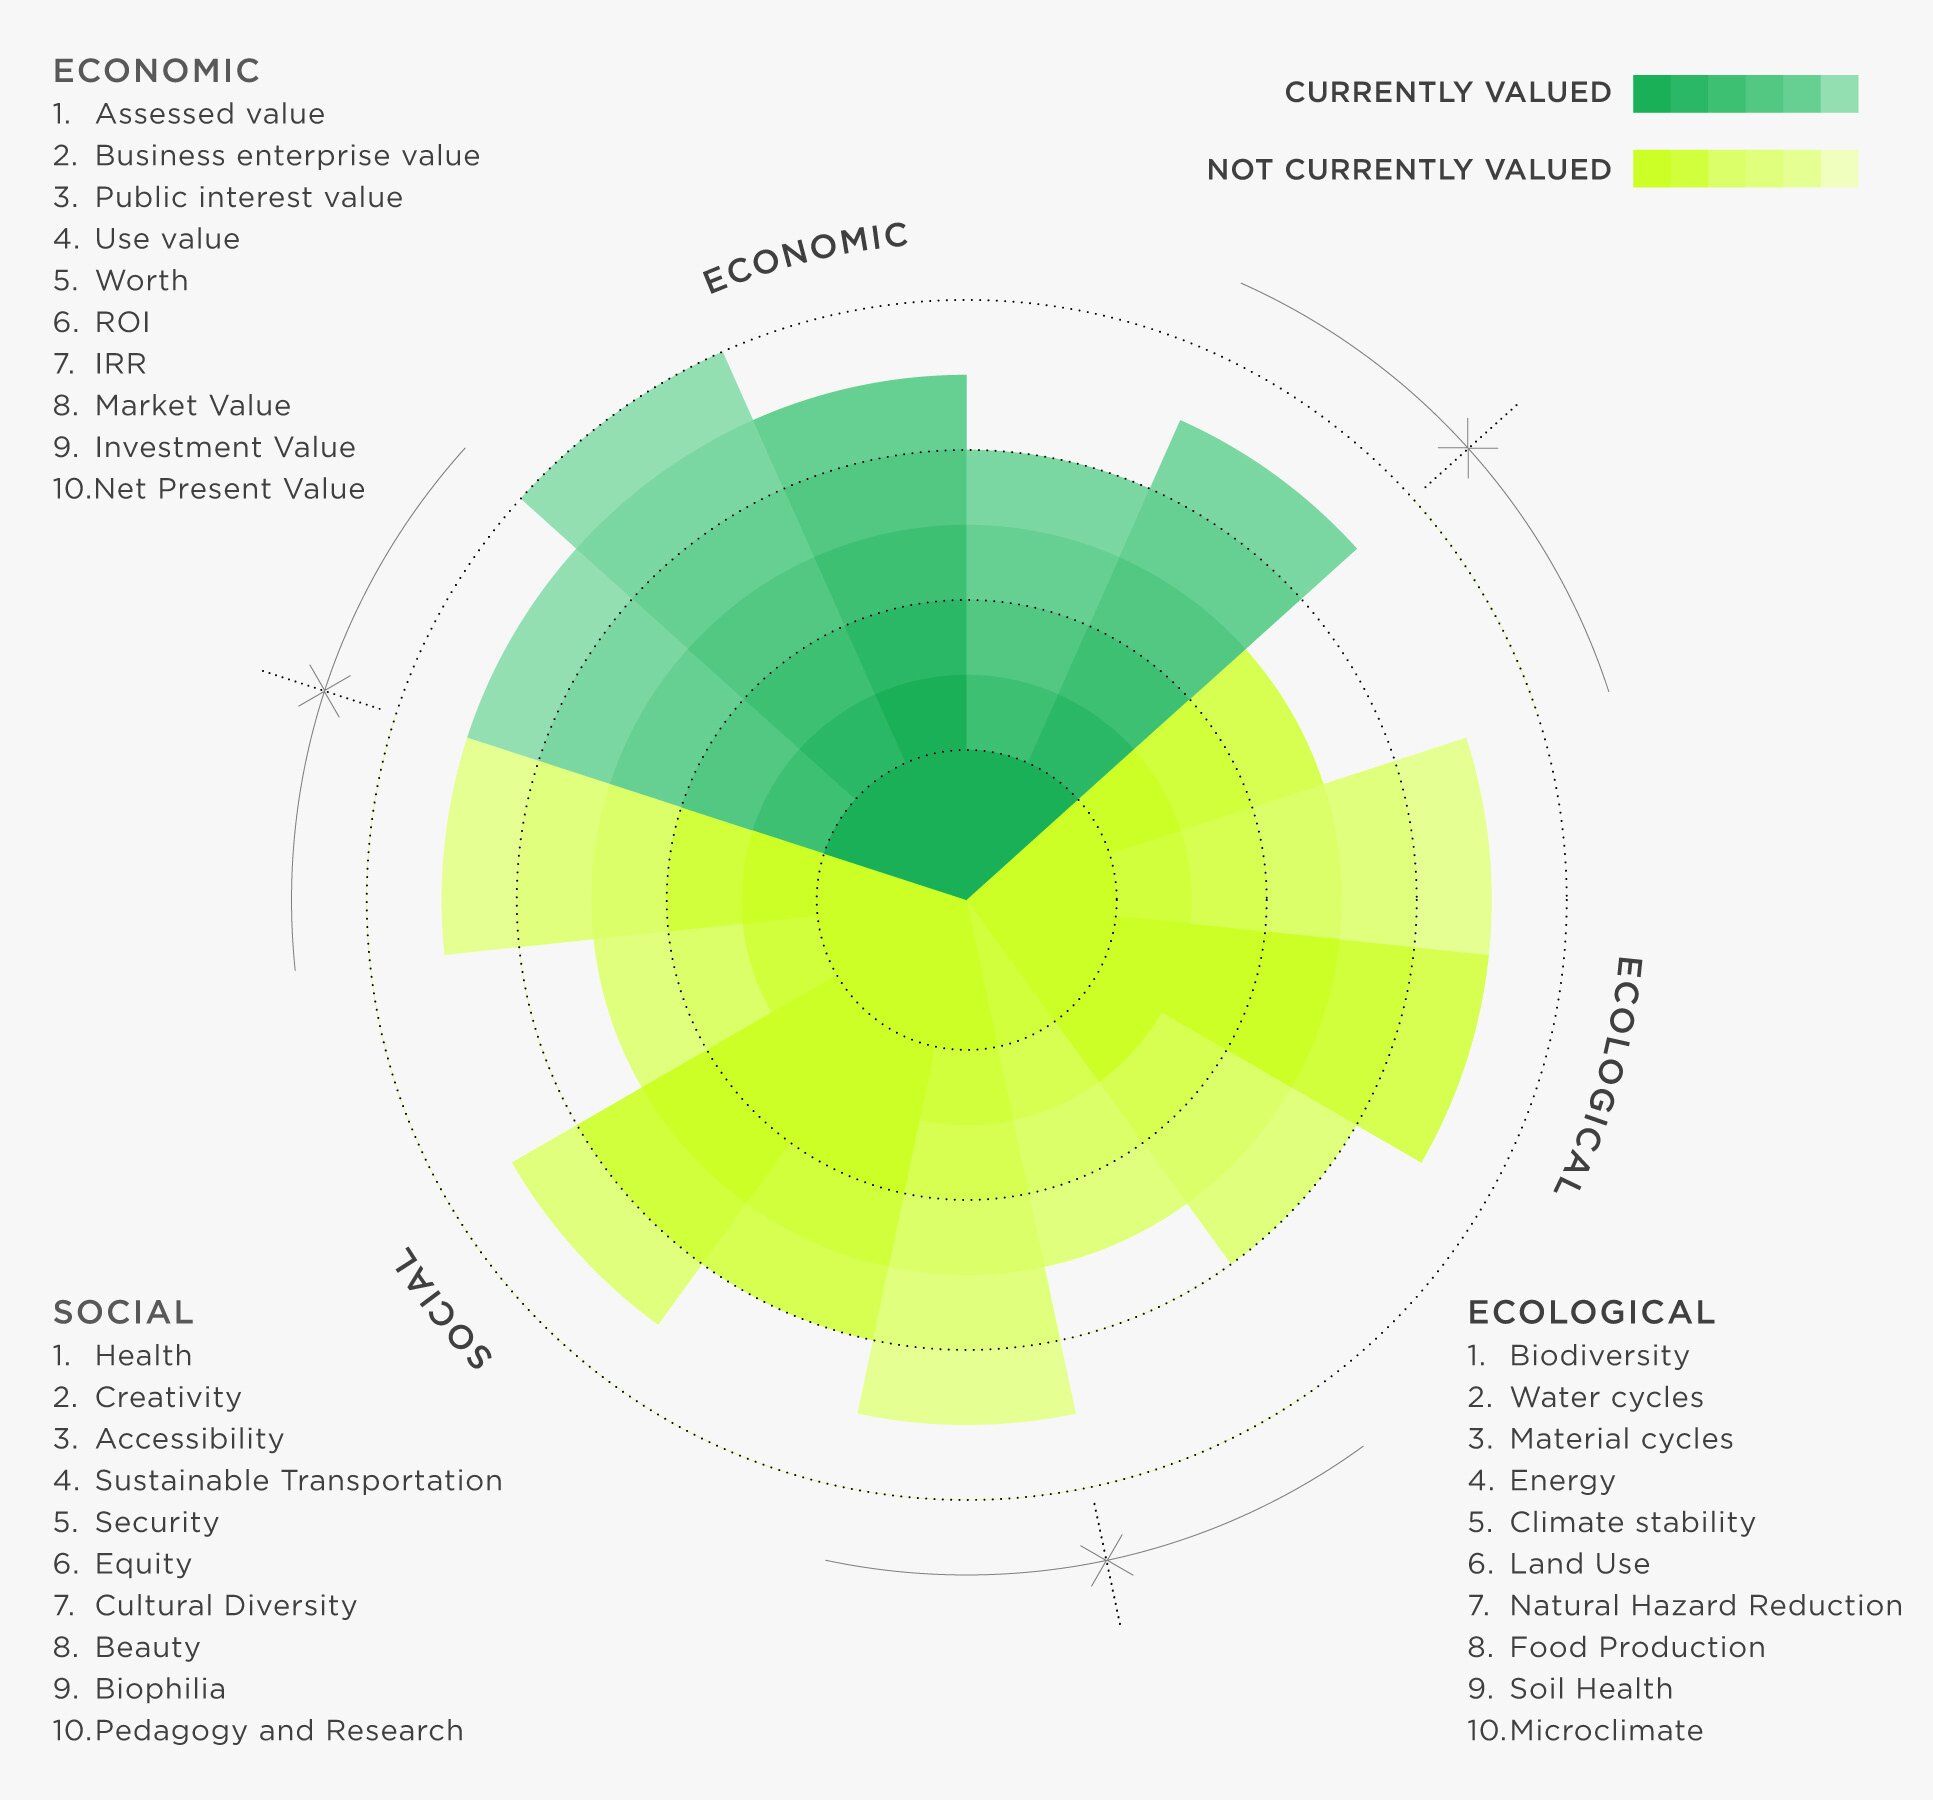
Ecosystem infographic for the International Living Building Institute (ILFI) that portrays the relative value of economic, ecological and social benefits in our society.

Graphics for the Jane Goodall Institute’s annual report illustrating the success and rapid growth of their chimpanzee rescue sanctuaries in the Republic of the Congo.

Infographic spread from the 25th anniversary report of the Housing Development Consortium of Seattle-King County (HDC), a nonprofit whose vision is “that all people live with dignity in safe, healthy and affordable homes within communities of opportunity”.
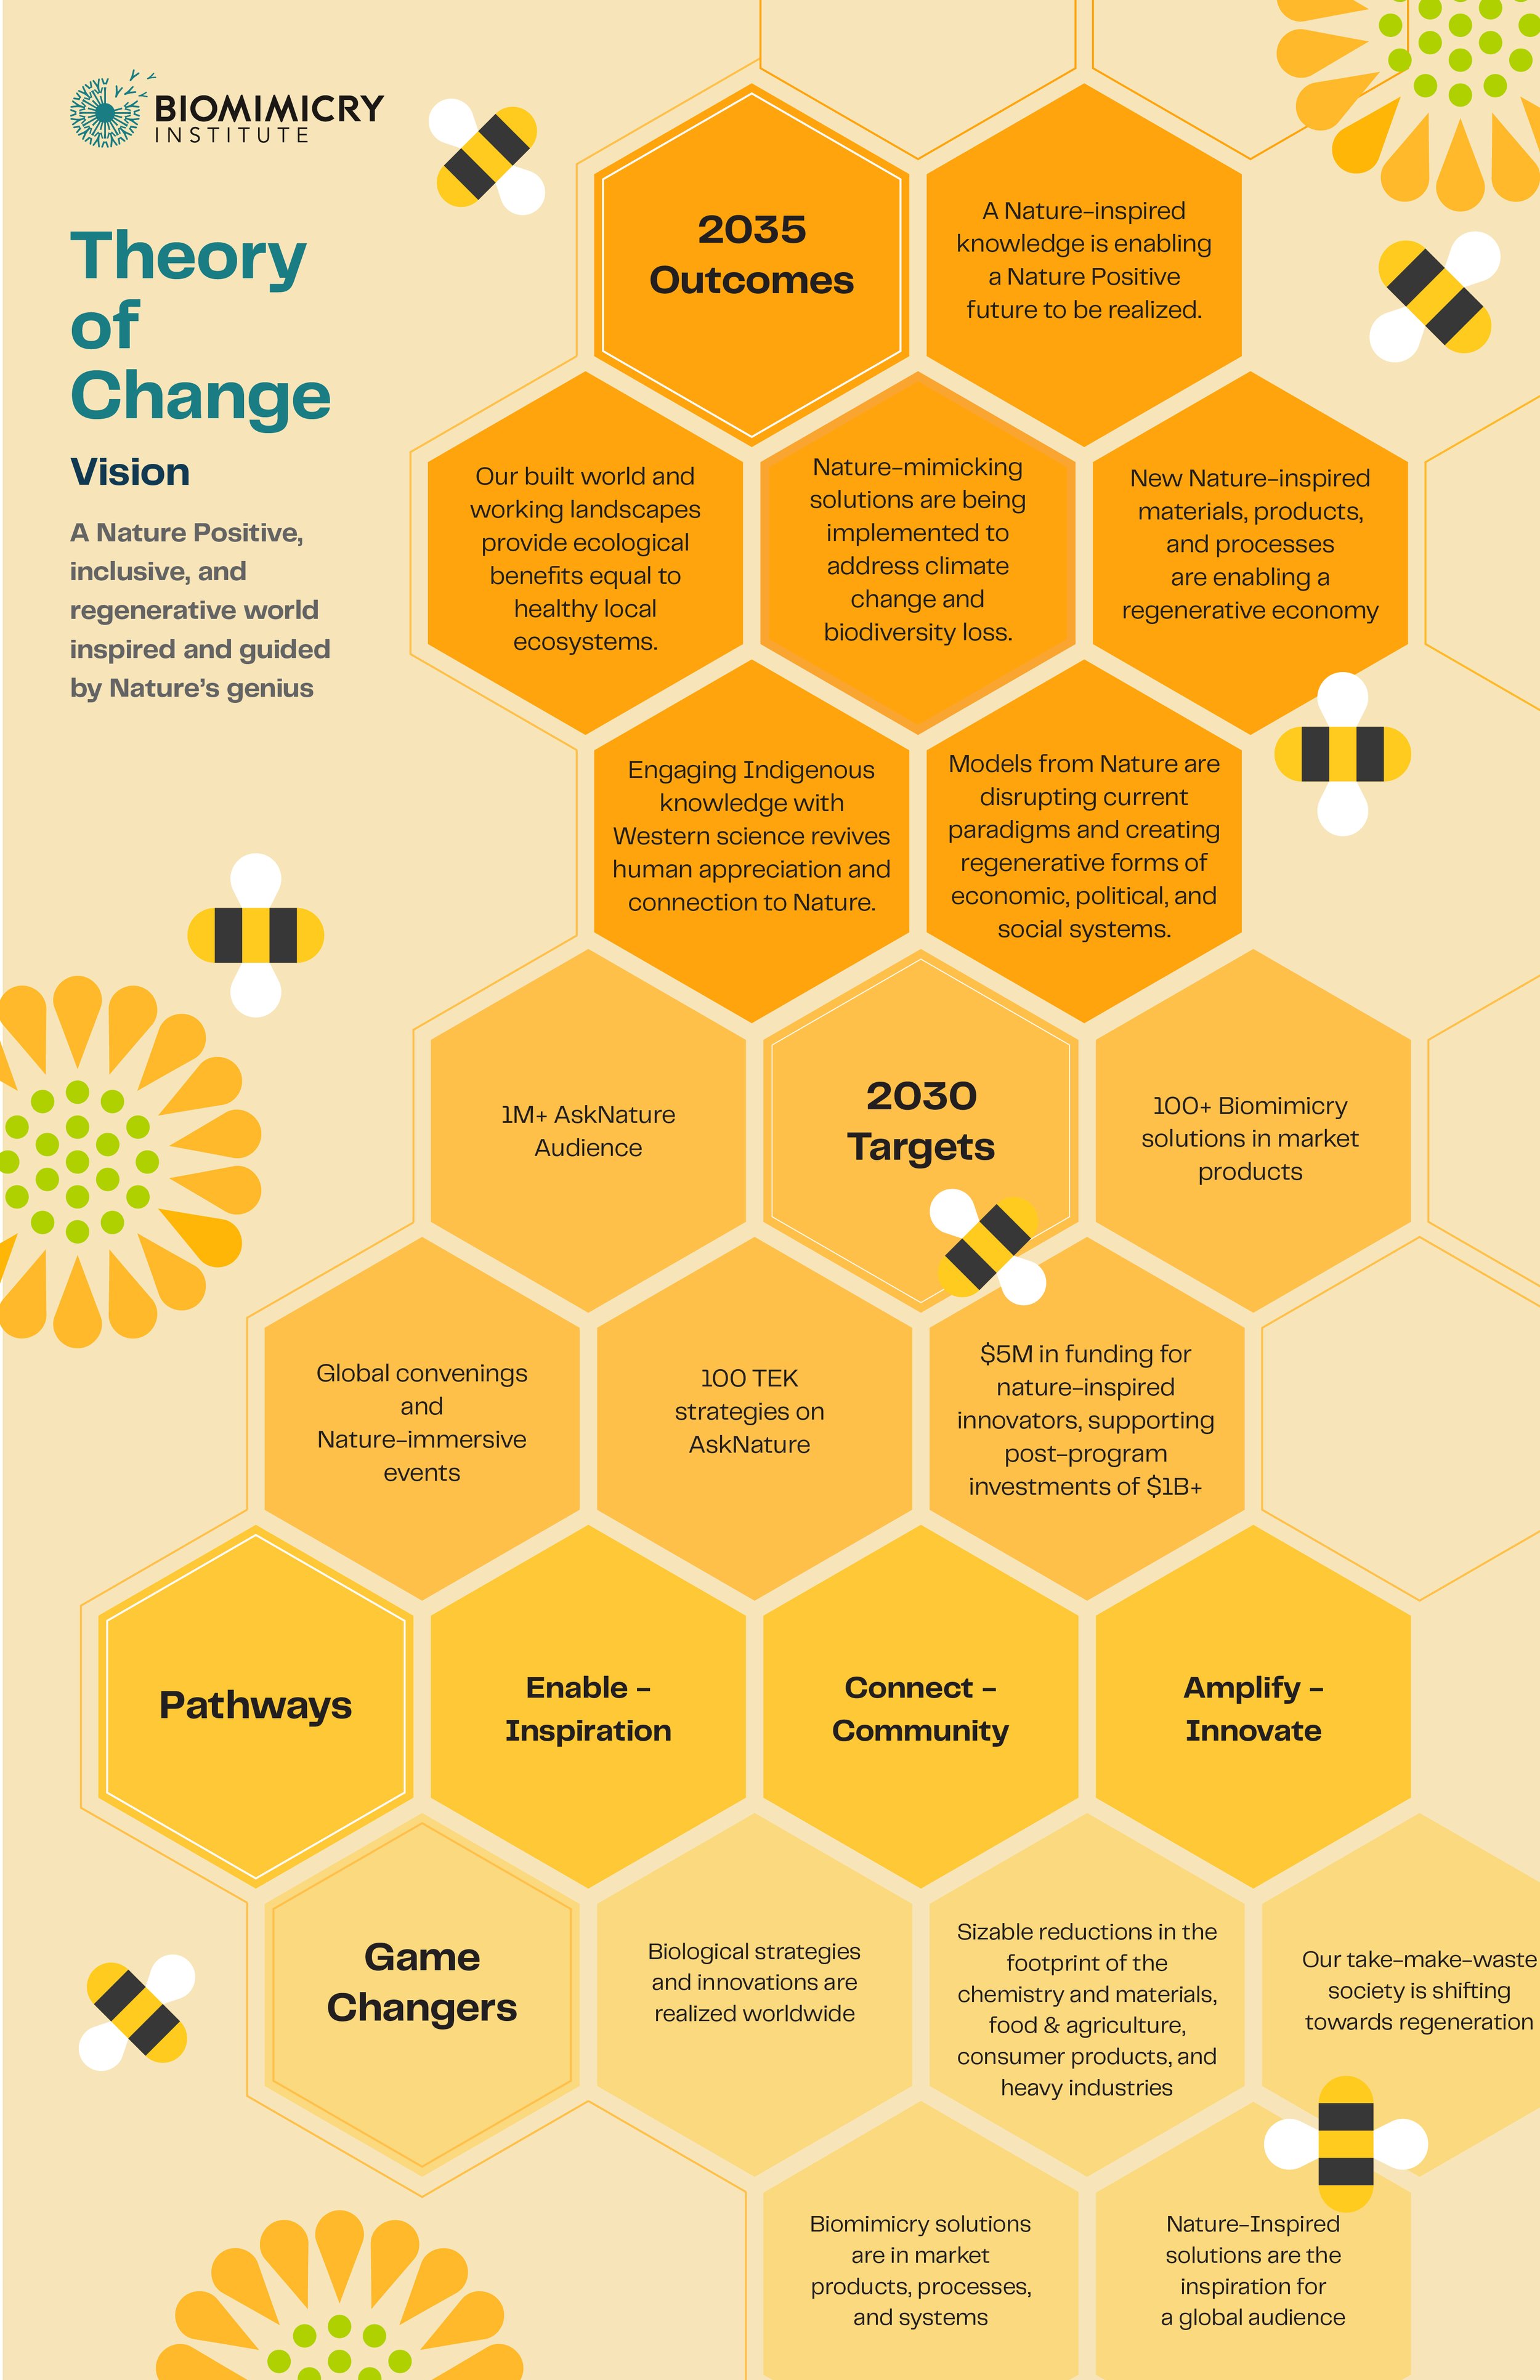
Infographic illustrating the Biomimicry Institute’s Theory of Change leading to the year 2035 outcomes.

Animated diagram of the CAR-T cell therapy injection process pioneered by the Seattle biotech BrainChild Bio for tumors in the central nervous system.